How I vibecoded my way into the #1 position on the Highload.fun leaderboard: My setup (Part II)
This is Part II. Part I is here: https://josusanmartin.com/blog/2026/01/18/the-game-has-changed-vibecoded-highload.html.
TL;DR: My setup is not an automated multi-agent pipeline. I mostly work out of VS Code on my MacBook, iterate + profile on a fast Contabo box, and validate on a Hetzner instance that matches the Highload CPU. Then I submit to Highload for the final verdict.
After sharing my results on Twitter, the most common request was: “Okay, what’s your setup?”
I’m going to disappoint you up front: it’s not some multi-agent setup with an orchestrator, fully automated, posting to GitHub. My approach is much more rudimentary. It’s mostly VS Code, a couple rented servers, and an unholy amount of iteration. Also: my “repo” is… not a repo. It’s a crime scene.
So if you want something more usable (and more automated), see: https://x.com/yenwod_/status/2007542404589727886.
The hardware (aka: why I needed three computers to do one dumb thing)
MacBook Pro M3 Max
This is my main machine. It’s where I write, read, prompt, diff files, copy leaderboards, and generally live.
A fast server (Contabo — AMD EPYC 7282 16-Core Processor)
This one is my “workhorse” box. It’s close-ish to the Highload judge CPU behavior, and most importantly: I can run perf on it. Profiling is half the game, and you can’t profile what you can’t see.
A Hetzner instance that matches the Highload CPU (E3-1271 v3)
This is the “truth machine.” Same CPU as the judge. If something is fast here, it’s actually fast. The downside: I can’t do deep kernel-level profiling there, so it’s mostly for validation, not investigation.
So the workflow ends up being:
- Contabo for profiling + fast iteration
- Hetzner for “does this survive contact with reality?”
- Highload submissions for the final verdict
Highload itself is the source of truth. Everything else is a simulation.
Where I code (including: yes, I did this on my phone)
I basically live in VS Code. Usually multiple windows:
- One local VS Code (Mac)
- One remote VS Code (Contabo)
- Sometimes another remote VS Code (Hetzner)
And yeah… I did a lot of iteration on my phone too. Two ways:
- Using Claude/Codex/ChatGPT in the cloud (surprisingly usable)
- SSH’ing into the servers and running scripts like a goblin
I even had to set my phone screen timeout to 10 minutes so it wouldn’t go to sleep mid-run and kill my flow.
My tools (who I use for what)
Claude Code
This is the iteration monster. It’s really good at taking “try 6 variations of this idea” and just doing it. It will generate multiple versions, run benchmarks, and tell you what won.
Codex (VS Code extension)
The VS Code extension is clutch because it doesn’t constantly nag for permissions the way some terminal workflows do. If you give it the keys, it will keep iterating like a caffeinated intern who doesn’t know fear.
Terminal agents (Claude/Codex)
I run Claude a lot from the terminal because the permission prompts can get annoying in-editor.
ChatGPT Pro
This one is weird, because it’s both:
- the most valuable tool for big jumps, and
- the slowest and most annoying in the feedback loop.
When you’re at 100k and the best is 20k, that gap is not “prefetch 4k vs 8k.” That gap is “you’re missing something fundamental.”
ChatGPT Pro was often the best at those “step back” moments, especially when I fed it the leaderboard and basically said:
“We are obviously dumb. What are we missing?”
But the iteration time is brutal. Sometimes it’s 20-40 minutes. Sometimes it feels like 90. And most of the time it’s still a miss.
So my meta-strategy became:
- keep Claude/Codex iterating fast
- occasionally throw a “big thinking” request at Pro
- pray it comes back with something that isn’t just “try using a faster hashmap”
Gemini
Gemini is fast. It’s a slot machine: sometimes it gives you something useful, often it gives you a “trust me bro” optimization that makes your runtime 10x worse. But because it’s fast, you can just keep pulling the lever.
Grok / Kimi / Manus / AntiGravity / Cursor agent
I tried them. Grok was the worst by far. The rest ranged from “meh” to “useless.” Also: I’m already a VS Code person, so unless an agent is meaningfully better, I’d rather stay in the tool I know.
My repo situation (I’m sorry in advance)
Okay. There is technically a repo.
But it’s a mess.
I tried to keep a clean GitHub repo synced across machines. In theory, that’s what a responsible adult does. In practice, when you’re iterating at insane speed across multiple agents and multiple servers, Git discipline collapses.
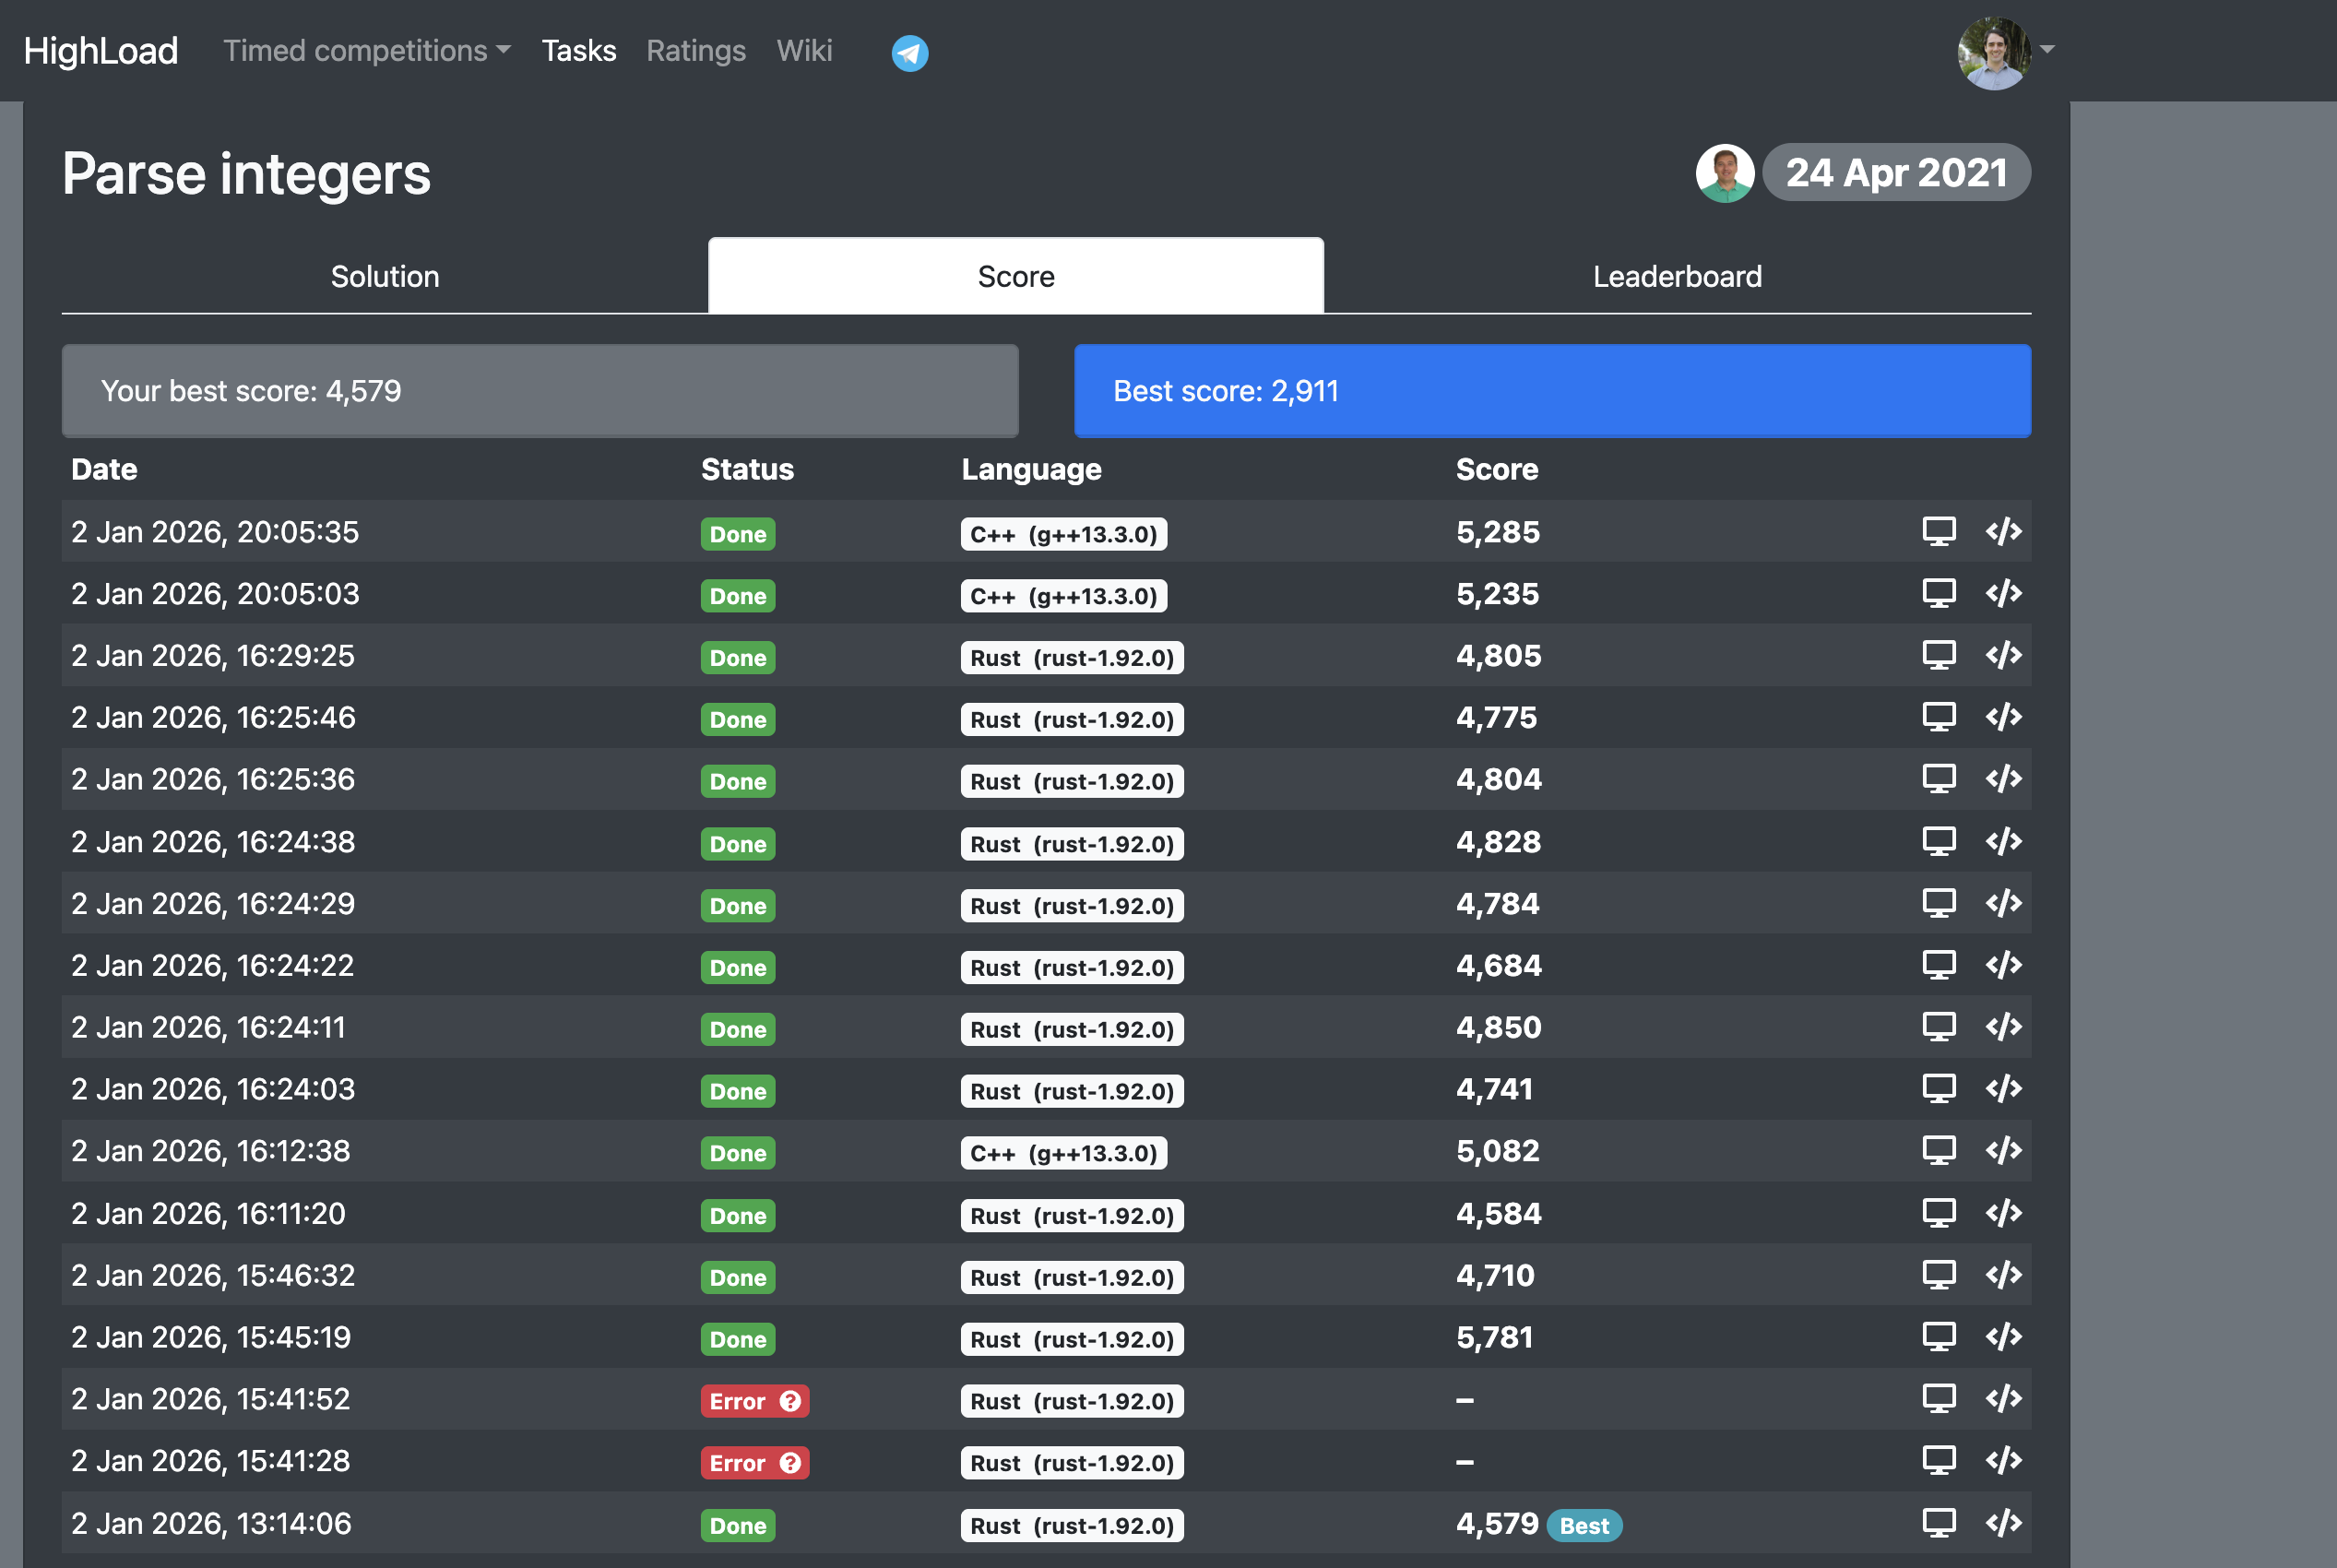
So what’s my source of truth?
Highload.
If I need to come back to a task, I go to my submission history and find the best-scoring code. That’s my “version control.” It’s not correct. It’s not moral. But it works.
File naming: version control by sheer aggression
Instead of task24.cpp, I have things like:
- 24_v187_claude_prefetch4k.cpp
- 24_v188_codex_no_sort.cpp
- 24_v189_try_simd_mask.cpp
- 15_v061_rust_unsafe_parse2.rs
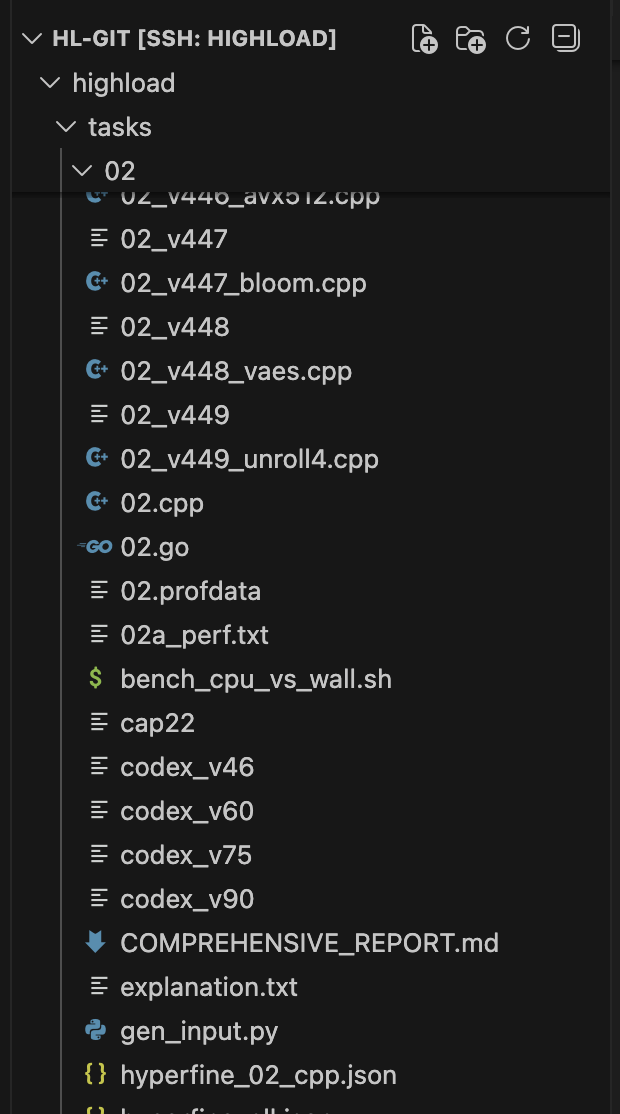
It’s not pretty, but it solves a real problem: I can compare files instantly.
Because when you iterate hundreds of times, a clean git history is great in theory… but in practice you want:
- quick diffs,
- quick swaps,
- and the ability to run 8 variants without thinking.
And that’s exactly what this chaos enables.
Also: when I’m running Claude and Codex in parallel on the same task, I keep them separated with filenames, otherwise they “pollute” each other’s direction and it becomes one big slurry of half-ideas.
The explanation file (what I paste into agents)
I usually keep a little explanation.md next to the code. Every time I ask an LLM/agent to iterate, I paste the task, the CPU constraints, my current notes, and a leaderboard snapshot so it knows how far we are from #1.
Here’s a real example (Task 4):
https://highload.fun/tasks/4
Format integers
You have a data stream of uint32 numbers in binary representation sending to STDIN. The byte order is little endian. Try to find the uint64 CRC of these numbers for the shortest time by the formula:

    CRC += number_crc(n),
where number_crc is the sum of the ascii ids of digits in the decimal system multiplied by the position of the digit.

Numbers quantity is 250 000 000.


CPU information
Model: Intel(R) Xeon(R) CPU E3-1271 v3 @ 3.60GHz

Flags: fpu vme de pse tsc msr pae ...

Notes
- Single-CPU constraint: mmap stays single-threaded.
- AVX2 path batches u32 accumulators and widens to u64 only every large block to reduce cvt/add overhead.
- Big-number path stays on small tables (FIXED3 + HIGH6) to keep gathers in cache.


+-------+-------------------+----------+-----------+
| Place | User              | Language | Score     |
+-------+-------------------+----------+-----------+
| 1     | zielaj            | C++      | 118,887   |
| 2     | Bernard Teo       | C++      | 231,111   |
| 3     | matsuoka-601      | C++      | 257,521   |
| 4     | Robert Burke      | C++      | 258,893   |
| 5     | Hal F             | C++      | 260,018   |
| 6     | Josu San Martin   | C++      | 414,635   |
+-------+-------------------+----------+-----------+
The actual workflow (the loop that matters)
Here’s the loop, simplified:
Stage 1: get a correct solution (fast)
I start by creating a file I literally call something like explanation.md where I paste:
- the problem statement
- input/output format
- constraints
- the target CPU (important)
- anything weird I noticed
Then I tell the agent: “solve it.”
Solving is not the hard part. These problems are trivial functionally. The first correct submission is usually 10x to 100x slower than the best solution, but that’s fine. It’s a baseline.
Stage 2: climb to “respectable” (top ~20)
Now we iterate:
- better parsing
- fewer allocations
- fewer branches
- fewer cache misses (sometimes by accident)
- simpler data structures
- get rid of obvious slow stuff
This can get you from “mid-table” to “top 20-ish” on a lot of tasks.
Stage 3: fight for #1 (the pain cave)
This is where “micro-optimizations” stop being enough.
To get to #1 you usually need a fundamental insight:
- stop doing work you don’t need to do
- exploit structure in the input
- reframe the problem so your hot loop becomes tiny
- or completely change the approach
This is also where you hit the main enemy: local optima.
Agents love climbing the hill you put them on. They’re great at tuning knobs. They’re bad at admitting the entire hill is the wrong mountain.
So when I’m stuck, my job becomes: force the agent to zoom out.
Escaping local optima (aka: why profiling matters)
Coding agents are amazing at micro-optimizing themselves into a corner.
If you’re at 100k and #1 is at 20k, most agents will happily spend 40 iterations shaving 2% off the wrong thing. They’ll optimize your sinking ship’s paint job.
What breaks you out is profiling + reframing:
- “This bloom filter alone is slower than #1’s entire runtime.”
- “My parsing takes longer than the top solution’s full execution.”
- “If this subroutine costs 30 cycles, it can’t be part of a winning design.”
Once you see that, you stop asking “how do I optimize this?” and start asking “how do I delete it?”
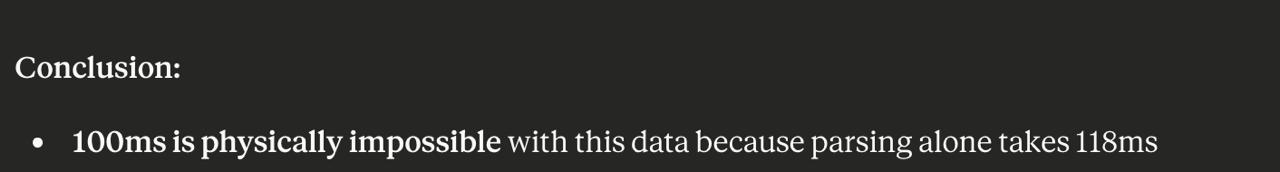
You also need to be careful and don’t allow the LLMs to gaslight you. They will try to convince you that the goal is literally impossible. You need to keep your ground and be stubborn.
The weird part: LLM biases are real
The biggest bias I noticed is: LLMs love sorting.
They will propose sorting for everything. And sorting is slow. Like: “if you can avoid sorting, avoid sorting” slow.
So you end up doing this ridiculous parenting loop:
- LLM: “Let’s sort…”
- Me: “No.”
- LLM: “Okay, but what if we sort differently…”
- Me: “NO.”
- LLM: “Okay, but what if we-“
- Me: “NO. BENCHMARK IT. LOOK AT THE NUMBERS.”
Another bias is safety/correctness paranoia. Which makes sense in real life. In this game, the input format is stable and the goal is speed. You can be aggressively unsafe and make assumptions that would be unacceptable in production.
And yes, sometimes I sanity-check data distributions by outputting tiny aggregated stats (histograms, counts, etc.). Not because I’m trying to be sneaky, but because knowing the shape of the data can completely change the optimal approach. And yes, some tools get weird about this, even when it’s obviously part of solving a speed puzzle.
Benchmarking and profiling (where the real progress comes from)
Iteration without feedback is just vibes. Here, feedback is everything.
Benchmarking
Every time you generate variants, you want to benchmark them:
- locally if possible (fast loop)
- on the identical CPU when you need to confirm the effect
- and with Highload itself when you want the final truth
Profiling
Profiling is how you avoid wasting 3 hours optimizing the wrong thing.
This happened to me multiple times:
- I was optimizing some clever data structure…
- and profiling showed parsing alone took longer than #1’s entire runtime
At that point the conclusion is simple:
- your clever structure doesn’t matter
- you’re doomed until parsing is basically free
- or until you stop parsing so much in the first place
Same story with Bloom filters:
- Bloom filter got me to like #5/#6 on a task
- but benchmarking showed it was inherently too slow to ever reach #1
- so I had to throw it away and reframe
And the funny part: after a certain level, swapping components doesn’t necessarily destroy performance. Once you’ve shaved the big waste, you can replace one module (Bloom filter -> hashmap, etc.) and still keep most of the speed, as long as you don’t blow up the hot loop.
Knobs: how I A/B test without losing my mind
Two patterns that helped a lot:
1) Generate multiple versions with one variable changed
prefetch_distance = [1024,2048,4096,8192]
Same code, one knob changed, benchmark all. Let reality decide.
2) Put compile-time toggles into the code
This is huge. Instead of rewriting everything, I add switches:
- sorting on/off
- prefetch on/off
- lookup tables on/off
- alternate parsing paths
// ============================================================
// TUNABLES (edit, re-submit, repeat)
// ============================================================

// 0 = original page-interleaved scan (your idea)
// 1 = linear scan (often faster on Haswell because HW prefetch works well)
#ifndef SCAN_MODE
#define SCAN_MODE 0
#endif

// If the input is ALWAYS exactly 250,000,000 bytes (task statement),
// skipping fstat() saves a syscall and a branch.
#ifndef ASSUME_SIZE_250M
#define ASSUME_SIZE_250M 0
#endif

// Affinity syscall is a tradeoff: can reduce jitter, but costs a syscall.
#ifndef USE_AFFINITY
#define USE_AFFINITY 0
#endif

// MAP_POPULATE can help if page-fault cost is included in timing,
// but can also just add upfront overhead. Try both.
#ifndef USE_MAP_POPULATE
#define USE_MAP_POPULATE 1
#endif
Now the agent can explore a space of variants quickly, and I can compare without having 40 divergent files.
(That said: I still ended up with 300 files per task sometimes. So. Yeah.)
“Exfiltration” / data analysis
Sometimes the fastest path is realizing something about the input distribution.
For later tasks, people shared generators (which helps a lot). For earlier tasks, you don’t always get the generator, so you need to infer structure.
One thing that helped: instrument the program to output tiny summaries:
- frequency counts
- histograms
- “how often does case X happen”
- min/max ranges
- repetition rates
You don’t have a lot of output space, so it’s like: what’s the highest-value fact I can squeeze into 200 characters?
This is where I hit an interesting limitation:
- Codex sometimes refused when I framed it as “exfiltration”
- Claude mostly understood the context (this is a game) and was fine
- occasionally it refused if I phrased it too explicitly
A concrete example: Task 24
One of my proudest #1s is Task 24, because I barely beat yenw0d (who is extremely good and also basically designed the arena).
If you want to see the task, here it is: Highload Task 24 - Cross-Margin Liquidation Engine
And here’s the funniest part: the biggest early insight was stupidly obvious, and the models kept missing it.
If a price tick comes in and only Bitcoin moves up, you do not need to re-check accounts that are only exposed to assets that didn’t move. That cuts an enormous chunk of useless work. It’s the kind of optimization that isn’t “faster code.” It’s “less code executed.”
That single realization was worth way more than any micro-optimization spree.
Was it enough to win? No. I still needed two more big realizations. I’m going to leave those as an exercise for the reader (and because half the fun is discovering them). But the meta-lesson is the important part:
The winning strategy is usually: don’t compute the thing.
Vibecoding has limits (and zielaj is the proof)
Even though I’m currently #1 on the global ranking, because vibecoding lets you move really fast, there are still levels to this.
There’s this participant zielaj who has only solved 7 problems… and he has the absolute best score in all 7 of them.
And I haven’t been able to beat him.
So yeah. Maybe vibecoding still has its limits.
The part I still find mind-blowing: code got abstracted away
This is the core vibe for me.
I’m doing low-level optimization against people who’ve been writing C++ for decades… while still not being able to confidently write “hello world” in Rust or C++ from memory.
And I mean that literally.
I don’t know print syntax off the top of my head. I don’t “speak” Rust. But I can reason about bottlenecks, instruction-level tradeoffs, data movement, and feedback loops, because the agents handle syntax and implementation.
So I spend my time on the conceptual layer:
- What can we delete?
- What is the true bottleneck?
- What is the minimum data we need?
- What’s the shape of the input?
- What does the CPU hate?
Would it help if I read every line of code? Maybe. But it would also slow me down. And in this game, iteration speed is everything.